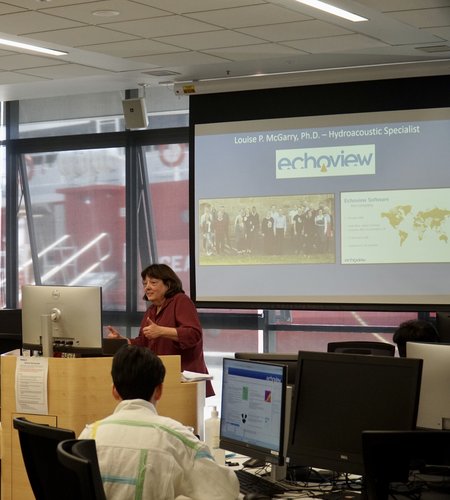
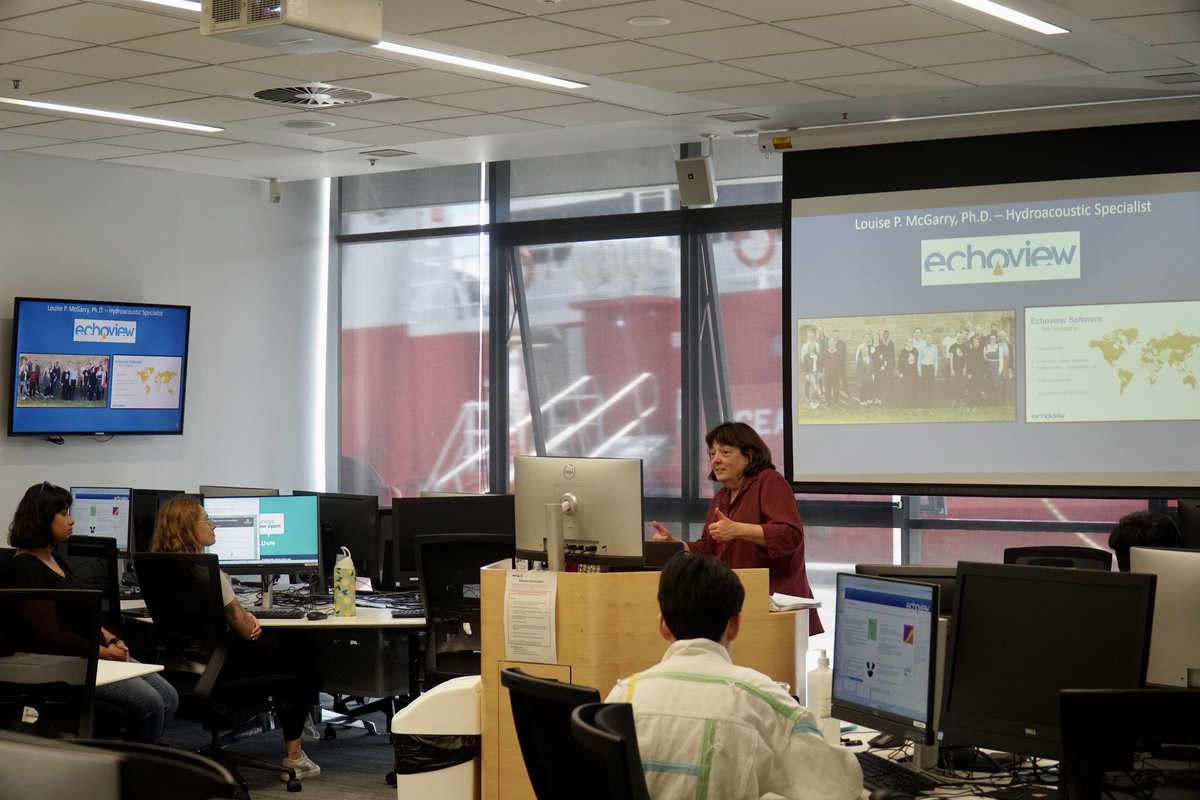
In February this year, at the invitation of Dr Andrew Fischer, the Unit Coordinator for the 2024 Joint UTAS-CSIRO Ph.D. Program in Quantitative Marine Science, Echoview Software’s Dr Louise McGarry delivered a guest lecture on working with hydroacoustic data.
The guest lecture provided students with an introduction to acoustic techniques (active and passive) for the study of marine organism presence, abundance, distribution, and behavior. With a focus on hydroacoustic data collected with scientific echosounders, the lecture included an introduction to fundamental hydroacoustic measurements, the advantages of remote sensing using echosounders, and the variety of platforms used for the deployment of hydroacoustic instruments.
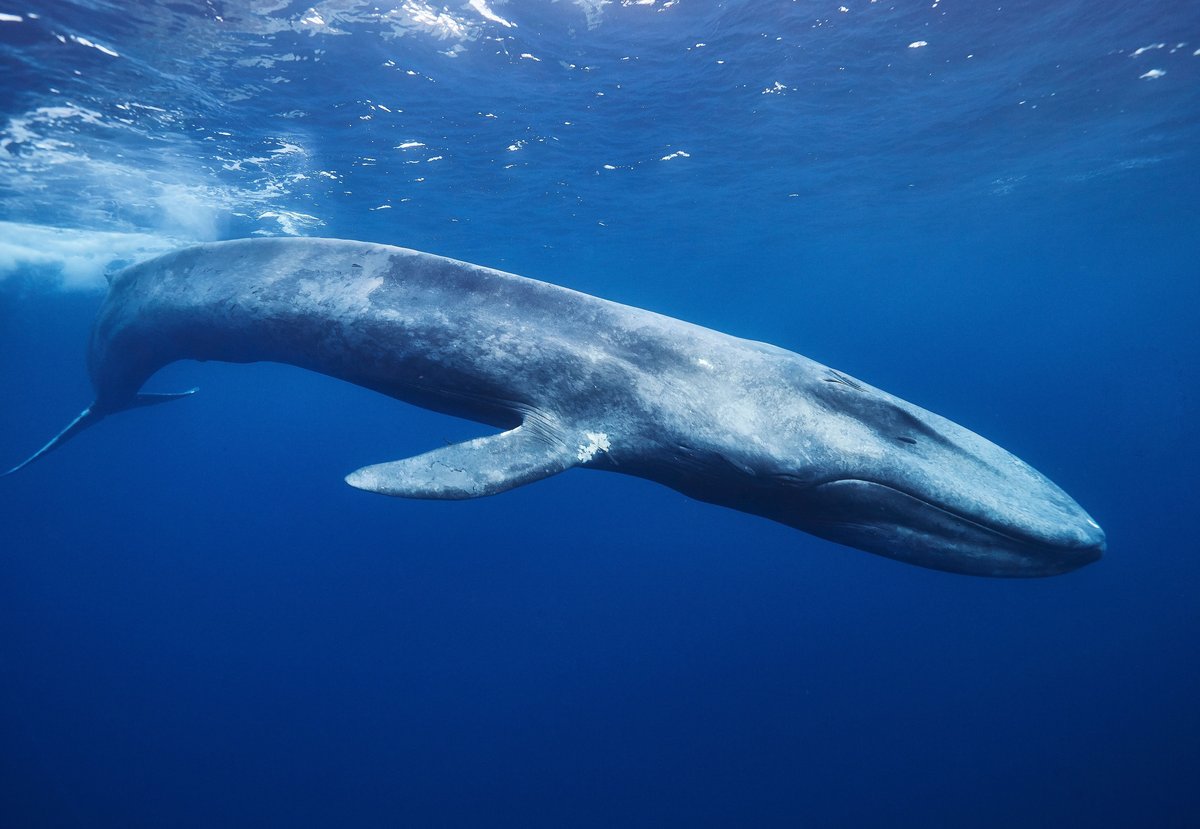
This lecture included a case study of how hydroacoustic data collected with a scientific echosounder along with concurrently collected foraging-behavior data made possible the quantification and study of the paradox and foraging ecology of the blue whale.
The guided lab practical session provided the students with an introduction to Echoview software functionality, organization, and approach. The students then created and post-processed an Echoview file of single beam echosounder data collected for vegetation analyses.
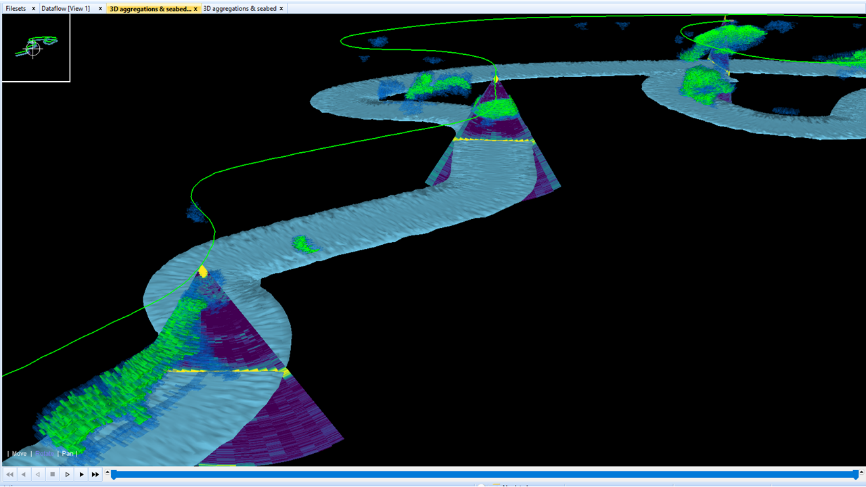
The end result was data ready for analysis export and an along-track 3D map and visualization of the eelgrass presence, density, and height relative to the bathymetry. Shown below is a 3D visualization including the seafloor and schools of sand eels. Spatial and acoustical statistics can be derived from the 3D representations of the fish aggregations and exported for analyses. This was shown to the students to demonstrate the 3D visualization, exploration, and quantification made possible by post-processing multibeam data in Echoview.
Through the lecture and lab practical, the students were provided with a valuable introduction into the benefits and application of hydroacoustic remote sensing techniques to quantitatively study marine ecology with a hands-on introduction to our flagship software, Echoview, which is used globally for post-processing and data analysis techniques for hydroacoustic data.
For further information on the course, QMS515 Techniques in Remote Sensing, please visit here.
Echoview Software offers tailored educational lectures and programs. If you would like further information, please email us at: info@echoview.com.